All guidesPROGRESS TRACKING
Read the trend you recorded.
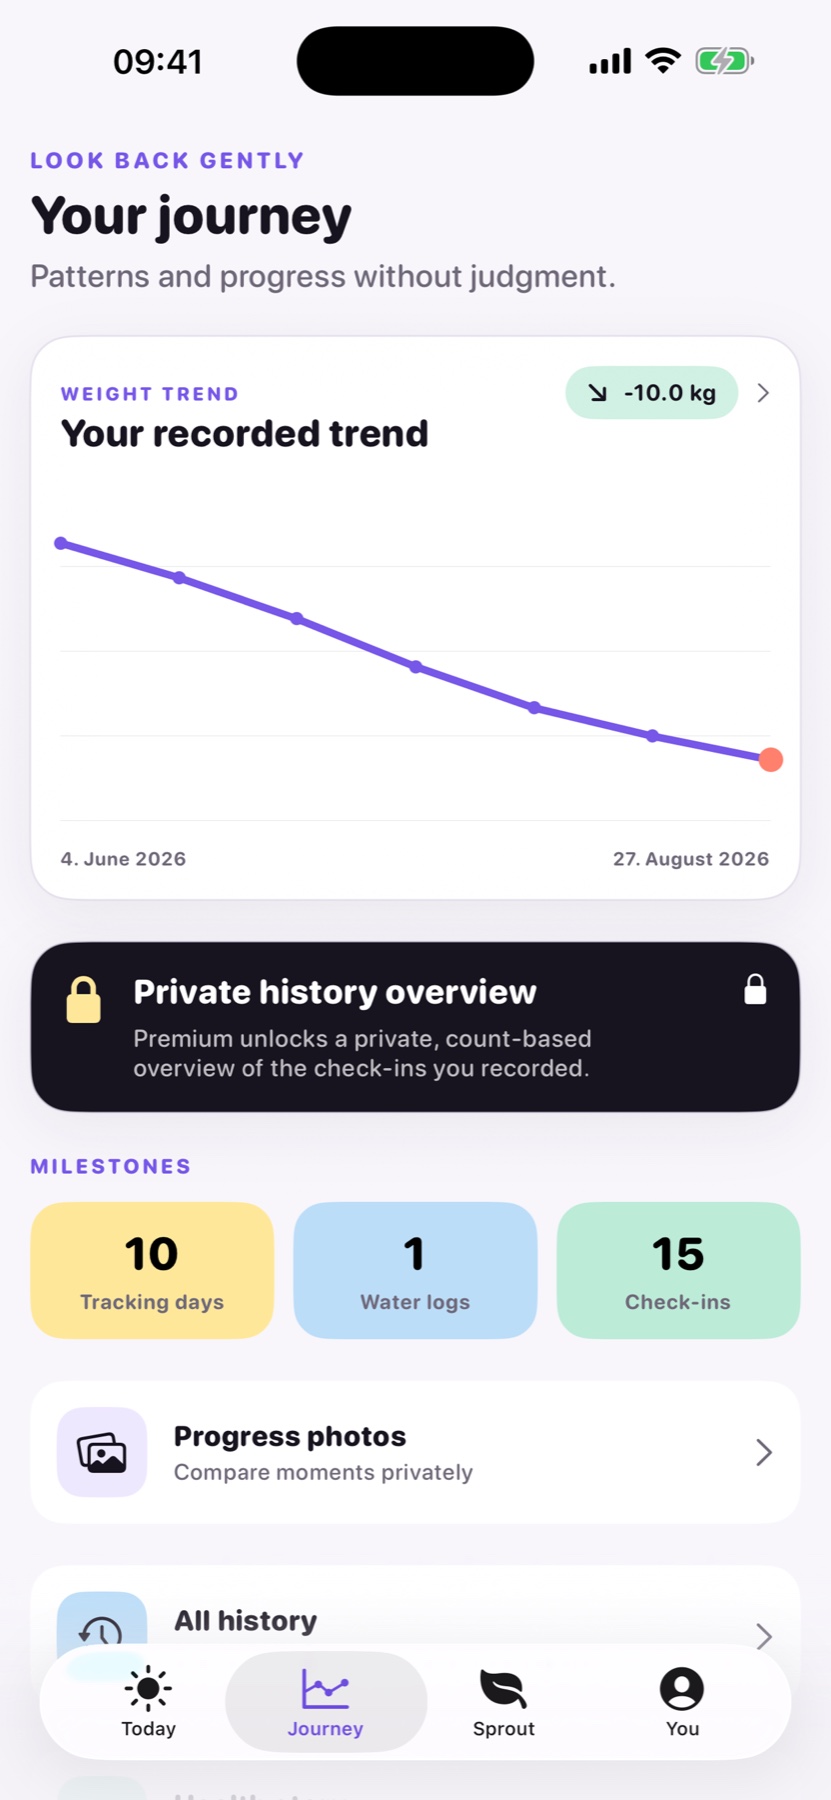
A chart can make several check-ins easier to understand than a list of isolated numbers. Mepace draws the line from your saved values.
Explore Mepace Real Mepace app screen · Demo data where shown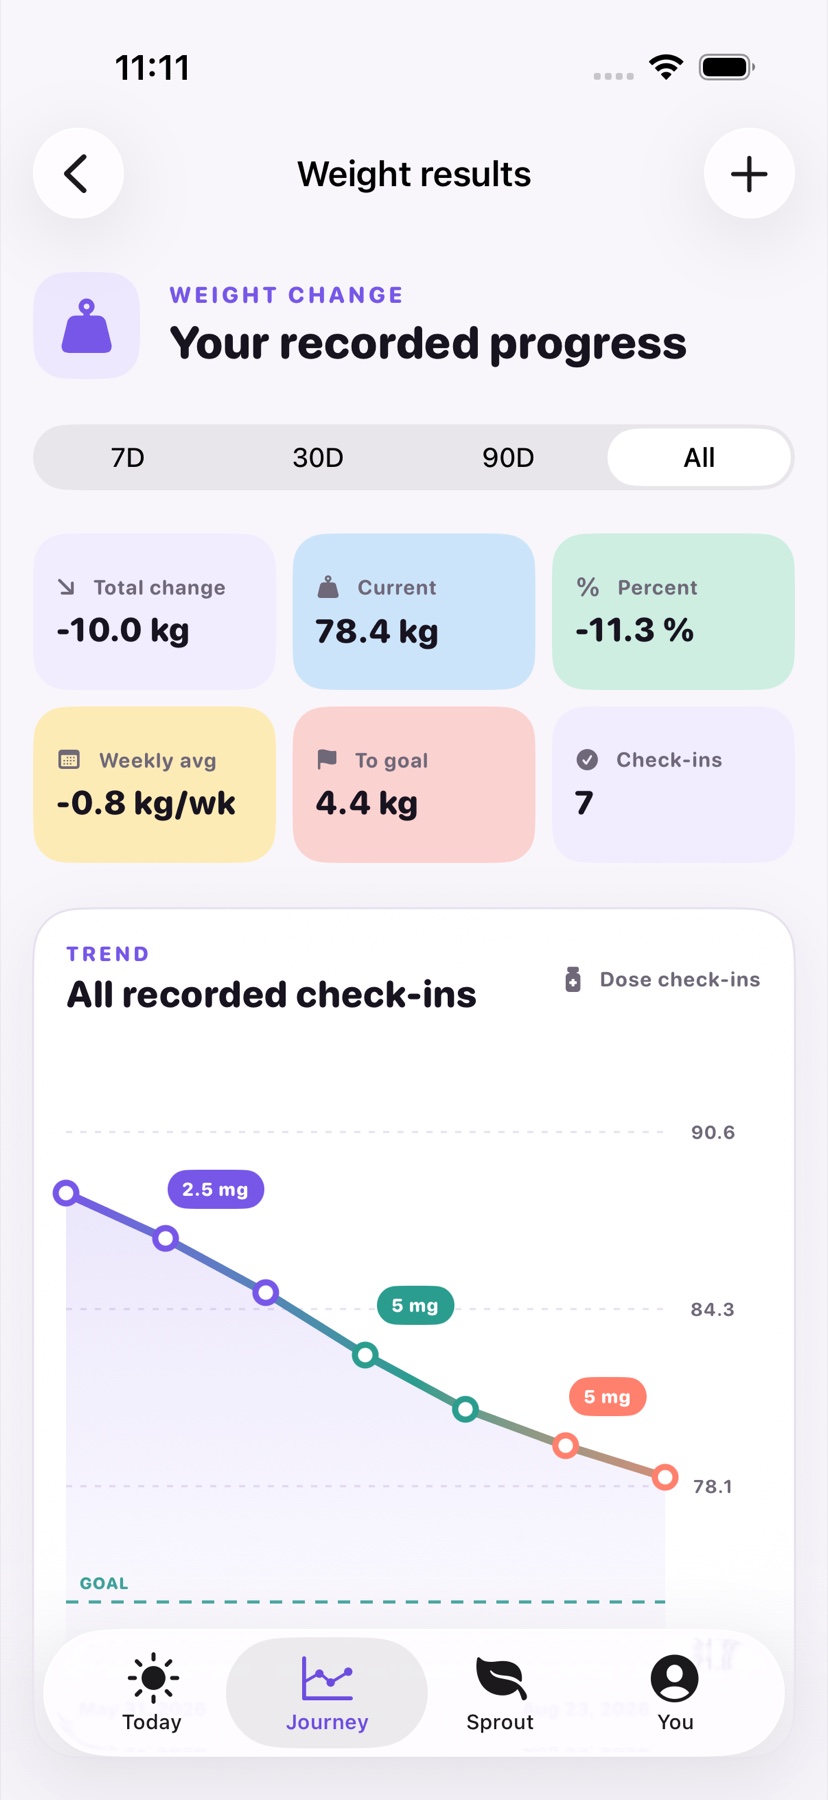
HOW IT WORKS
A chart based on your own entries
The selected range changes what the chart compares. It does not turn a short stretch of data into a prediction.
01
Add dated weigh-ins
Use the weight quick log to build a history in the units shown by the app.
02
Select a range
Review the period that helps answer your question, from recent weeks to a longer view.
03
Check the calculation
Total and percentage change use the first and last entries in the selected period; they describe records, not a recommended pace.
GOOD TO KNOW
Does a downward line prove a treatment is working?
No. The chart is a record of measurements. A clinician can help interpret your health and treatment in context.